case study
I run delivery operations at Tiller, a B2B marketing agency for Software Brands.
- Branding
- Web Design
- Software Engineering
- SEO
- Paid Advertising
- CRO
Here's how things worked when I showed up, and how they work now.
Web & Software Engineering
Then: Development was slow. We weren't using AI to write code.
Now: I introduced Claude Code. Developers now use it to build websites, apps, and software.
An illustration of a Claude Code session: a developer asks for a pricing page built from a Figma frame; Claude Code reads the frame, writes the page, adds a Playwright visual check, and runs it, with 6 tests passing. A sample session, not real output. Standard Operating Procedures (SOPs)
Then: Tiller had 0 SOPs when I arrived.
Now: Tiller now has 86 SOPs, all in one standard format, with training videos.
SOP Database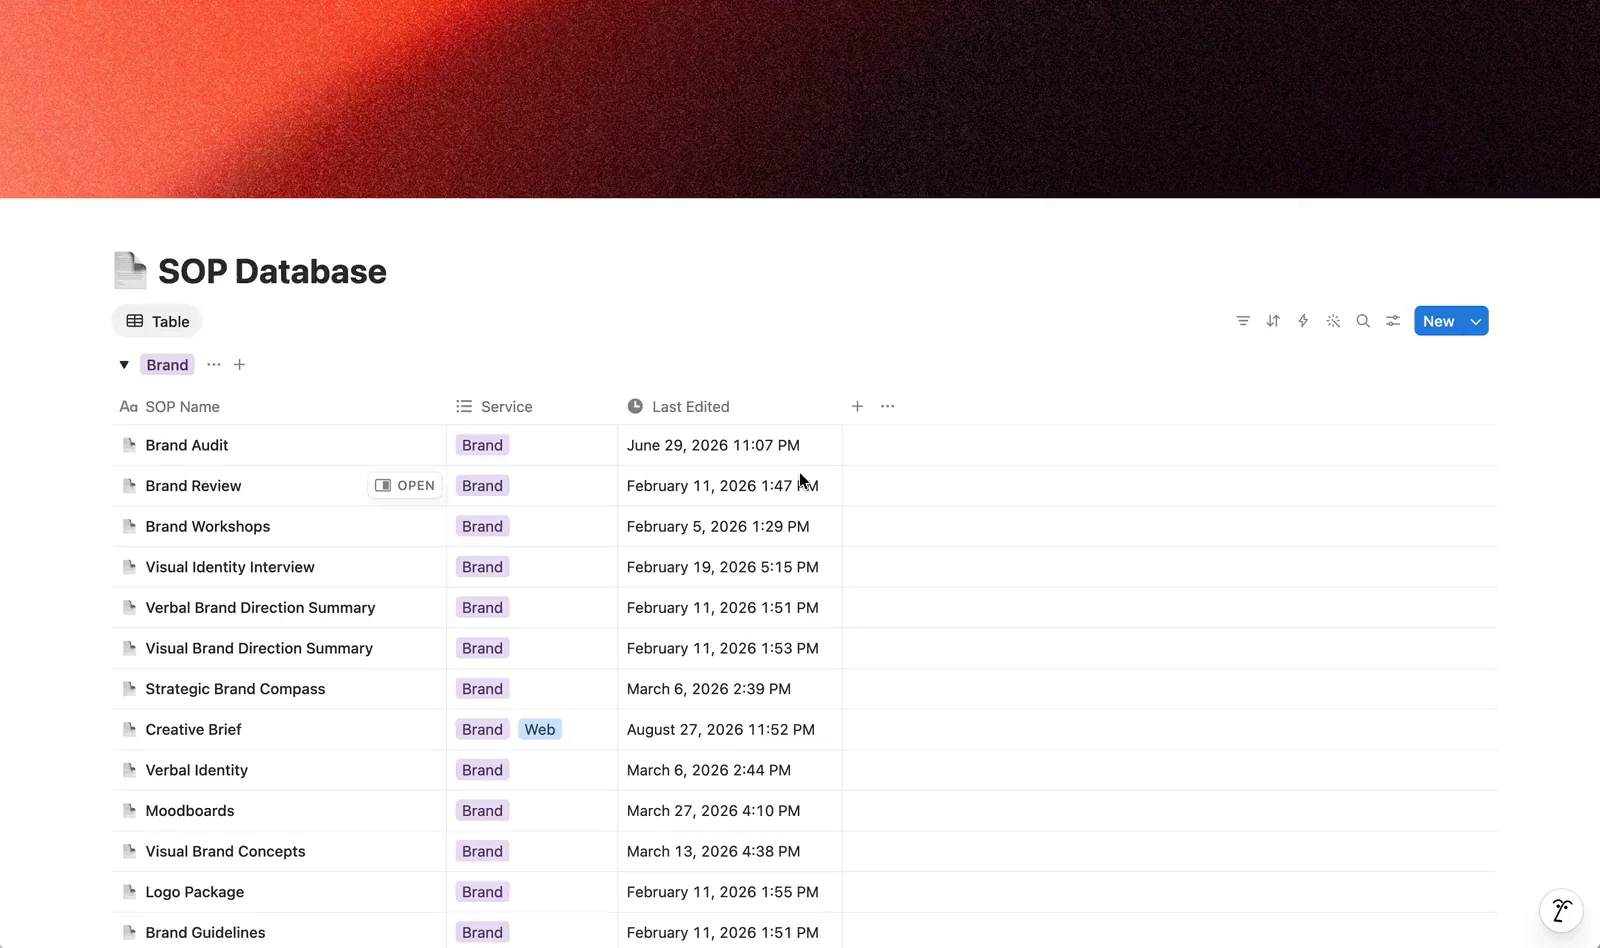
Utilization & Capacity
Then: Tiller had no view of utilization, capacity or resourcing. These are reports a marketing agency's health depends on.
Now: I led the build of a web app that connects our project management tools, timelines & Google Calendar, so we can finally see that data.
An illustration of the resourcing view in the utilization app, with sample data rather than real Tiller figures. Team utilization, this week
88%
Overbooked, next 6 weeks
3 people
5 weeks over 100%
Open capacity, next 6 weeks
163 hours
Room to take on work
Sample allocation, booked hours as a percentage of capacity, by person and week starting Allocation by person This weekNow (Nov 2) Nov 9 Nov 16 Nov 23 Nov 30 Dec 7 Brand designer 82%, 30 of 36 hours 91%, 33 of 36 hours 96%, 35 of 36 hours 88%, 32 of 36 hours 74%, 27 of 36 hours 60%, 22 of 36 hours Web designer 104%, 37 of 36 hours 112%, 40 of 36 hours 98%, 35 of 36 hours 90%, 32 of 36 hours 85%, 31 of 36 hours 70%, 25 of 36 hours Developer 95%, 34 of 36 hours 99%, 36 of 36 hours 188%, 30 of 16 hours, 20 hours time off from Google Calendar 97%, 35 of 36 hours 92%, 33 of 36 hours 86%, 31 of 36 hours Paid media 118%, 42 of 36 hours 109%, 39 of 36 hours 96%, 35 of 36 hours 92%, 33 of 36 hours 88%, 32 of 36 hours 80%, 29 of 36 hours CRO analyst 45%, 16 of 36 hours 52%, 19 of 36 hours 64%, 23 of 36 hours 70%, 25 of 36 hours 78%, 28 of 36 hours 72%, 26 of 36 hours Processes & workflows
Then: Every build was scoped from scratch, as if it were the first one, which made complex work slow to sell.
Now: I helped redesign the offering into tiered, productized services. Sales can now sell complex work without rescoping every build.
Quality Assurance (QA)
Then: Several people checked sites by hand with no standard QA process. Project managers usually ended up carrying the work.
Now: Automated checks compare the built site with the design team's real Figma designs before and after launch.
What I implemented
01 Design
Figma
The design team creates the screens we check against
02 Build
Claude Code
Developers use Claude Code to write the code
03 Ship
GitHub
We push the code to GitHub
04 Test
Playwright
GitHub Actions runs Playwright to compare the site with Figma
If a check fails, it posts to Slack
05 Launch
Live site
Playwright checks the site again after launch
Visual regression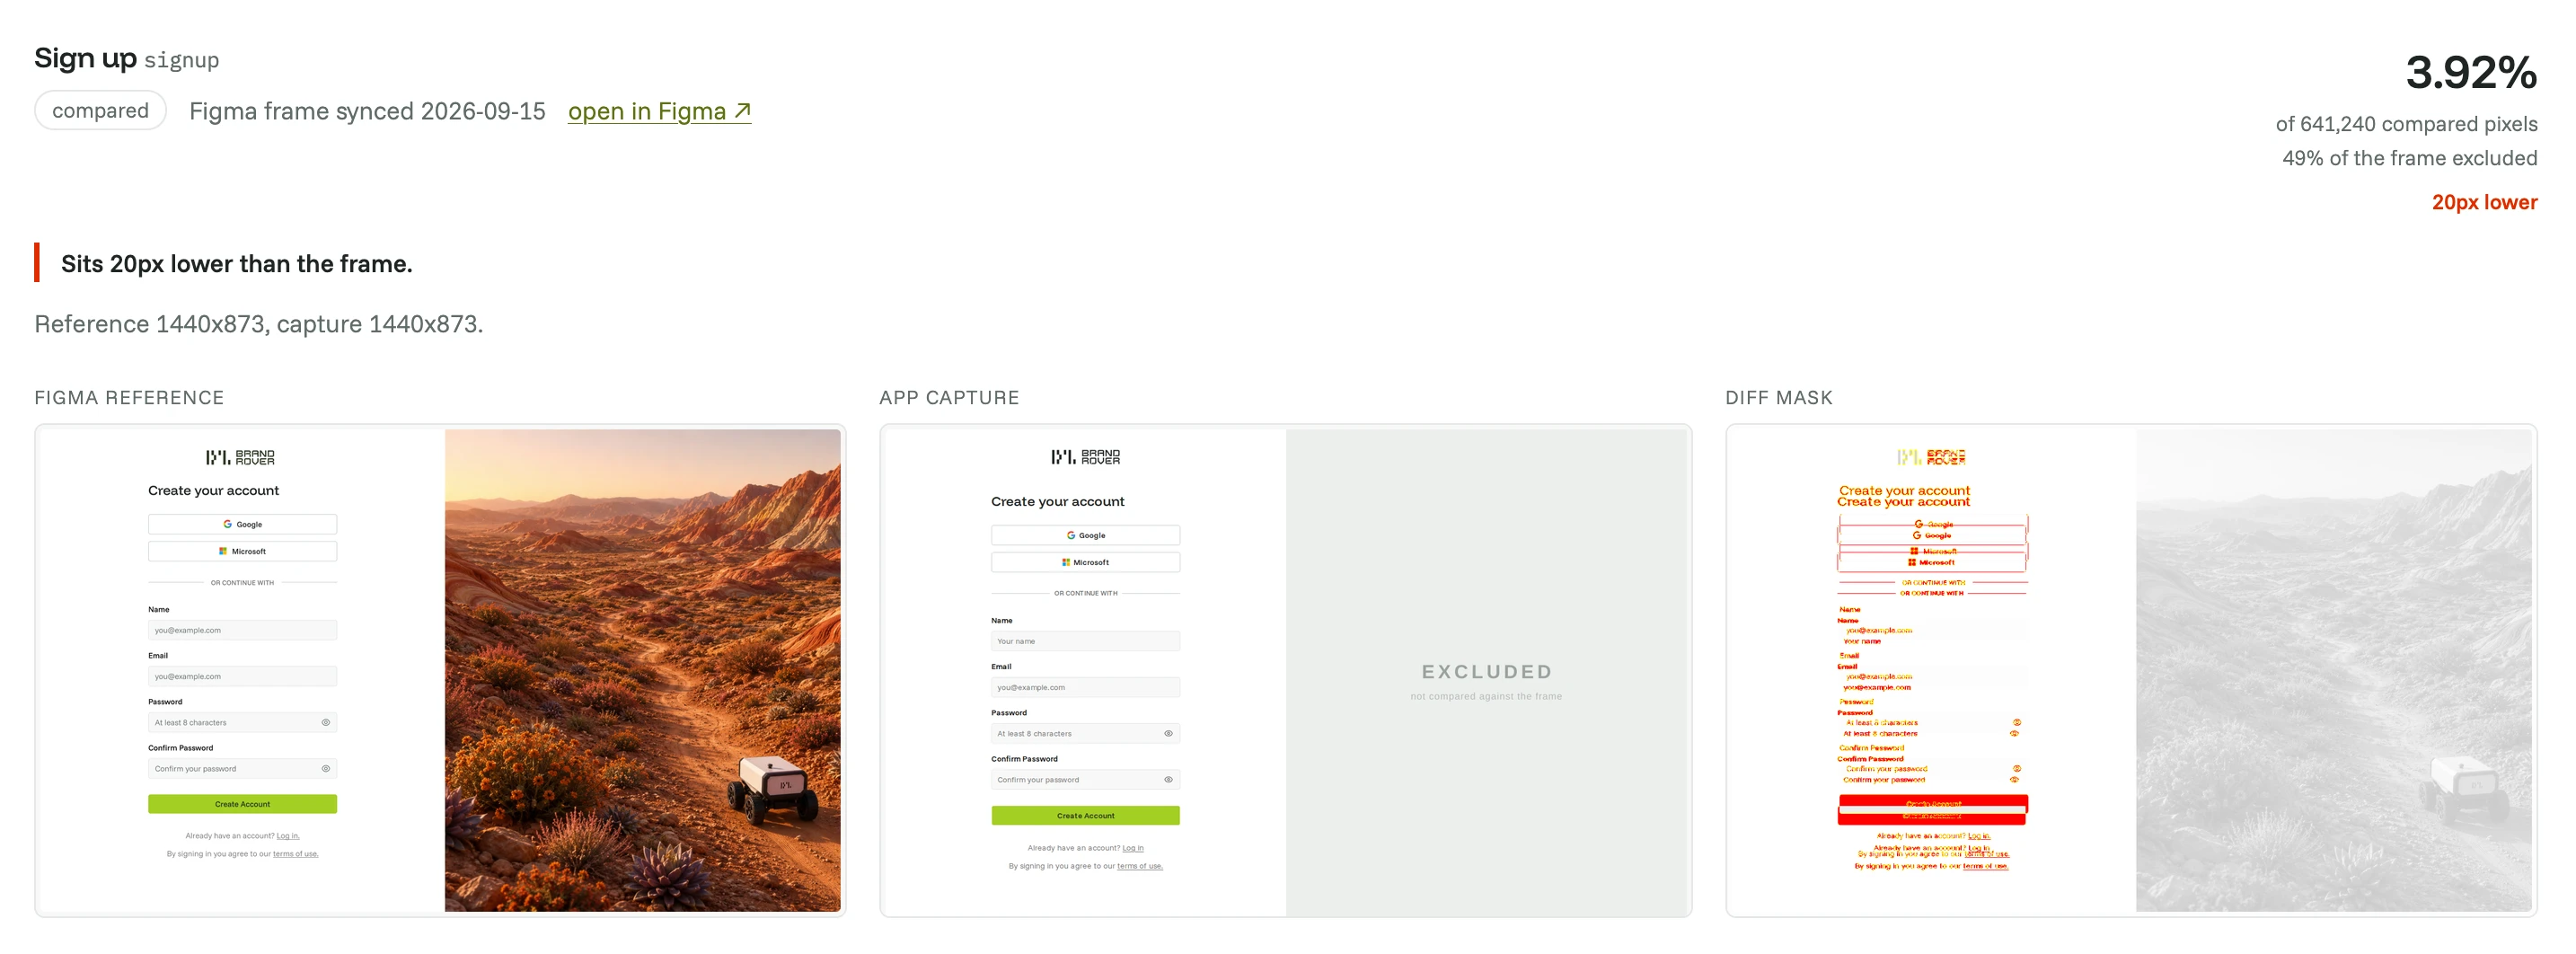
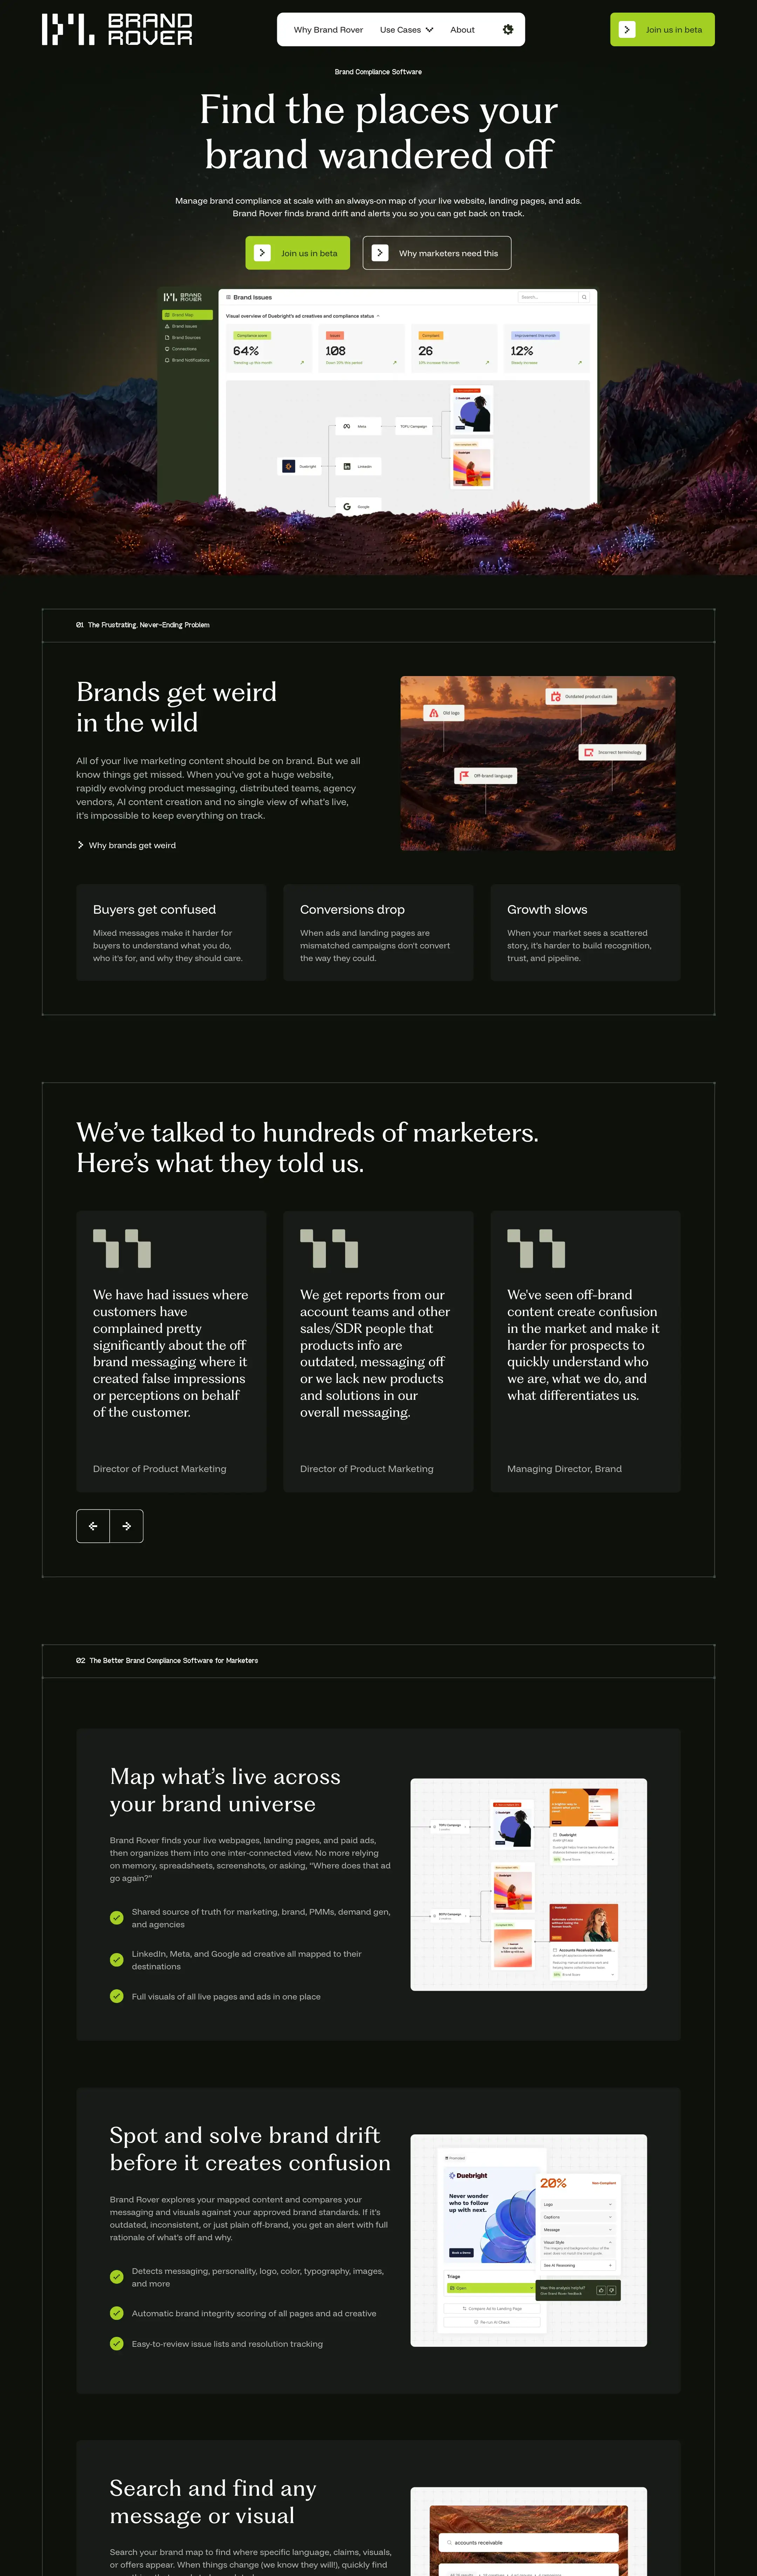
The suite comparing Brand Rover's sign-up page with its Figma frame. The built page sits 20px lower than the design, so 3.92% of the compared pixels differ. Client reporting
Then: Client reports were fragmented in a mix of Google Sheets and Data Studio.
Now: Replaced Google Data Studio with interactive Claude dashboards.
An illustration of an interactive client marketing dashboard built with Claude, with sample data for an anonymous client. Qualified leads
427+18%
Cost per lead
$151-6%
Pipeline influenced
$5.8M+21%
vs previous 90 days · Sample data
Qualified leads
per weekLeads by channel
Qualified leads, 30 days, sample data Period Leads Oct 3 4 Oct 4 6 Oct 5 7 Oct 6 6 Oct 7 5 Oct 8 2 Oct 9 2 Oct 10 5 Oct 11 7 Oct 12 8 Oct 13 7 Oct 14 6 Oct 15 3 Oct 16 2 Oct 17 6 Oct 18 8 Oct 19 7 Oct 20 9 Oct 21 7 Oct 22 3 Oct 23 2 Oct 24 7 Oct 25 9 Oct 26 8 Oct 27 10 Oct 28 8 Oct 29 4 Oct 30 3 Oct 31 8 Nov 1 10 Qualified leads, 90 days, sample data Period Leads Week of Aug 3 27 Week of Aug 10 29 Week of Aug 17 28 Week of Aug 24 31 Week of Aug 31 30 Week of Sep 7 33 Week of Sep 14 32 Week of Sep 21 34 Week of Sep 28 33 Week of Oct 5 36 Week of Oct 12 35 Week of Oct 19 38 Week of Oct 26 41 Qualified leads, 12 months, sample data Period Leads Nov 2025 62 Dec 2025 68 Jan 2026 71 Feb 2026 79 Mar 2026 84 Apr 2026 88 May 2026 97 Jun 2026 104 Jul 2026 112 Aug 2026 118 Sep 2026 131 Oct 2026 142 SEO & AI search
Then: Tiller's own site barely showed up on Google for its main services.
Now: My SEO strategy took it into Google's top 5 for its main keywords and into Google AI Overviews.
Search Console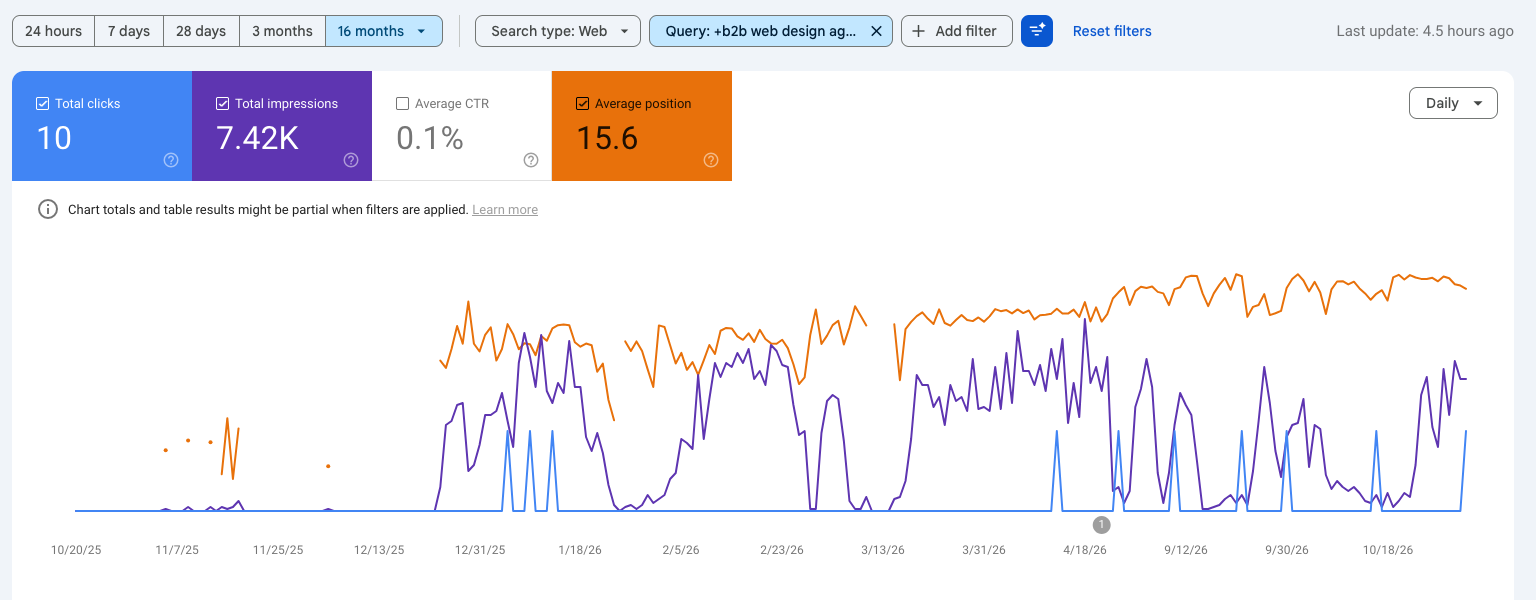 Google AI Overview
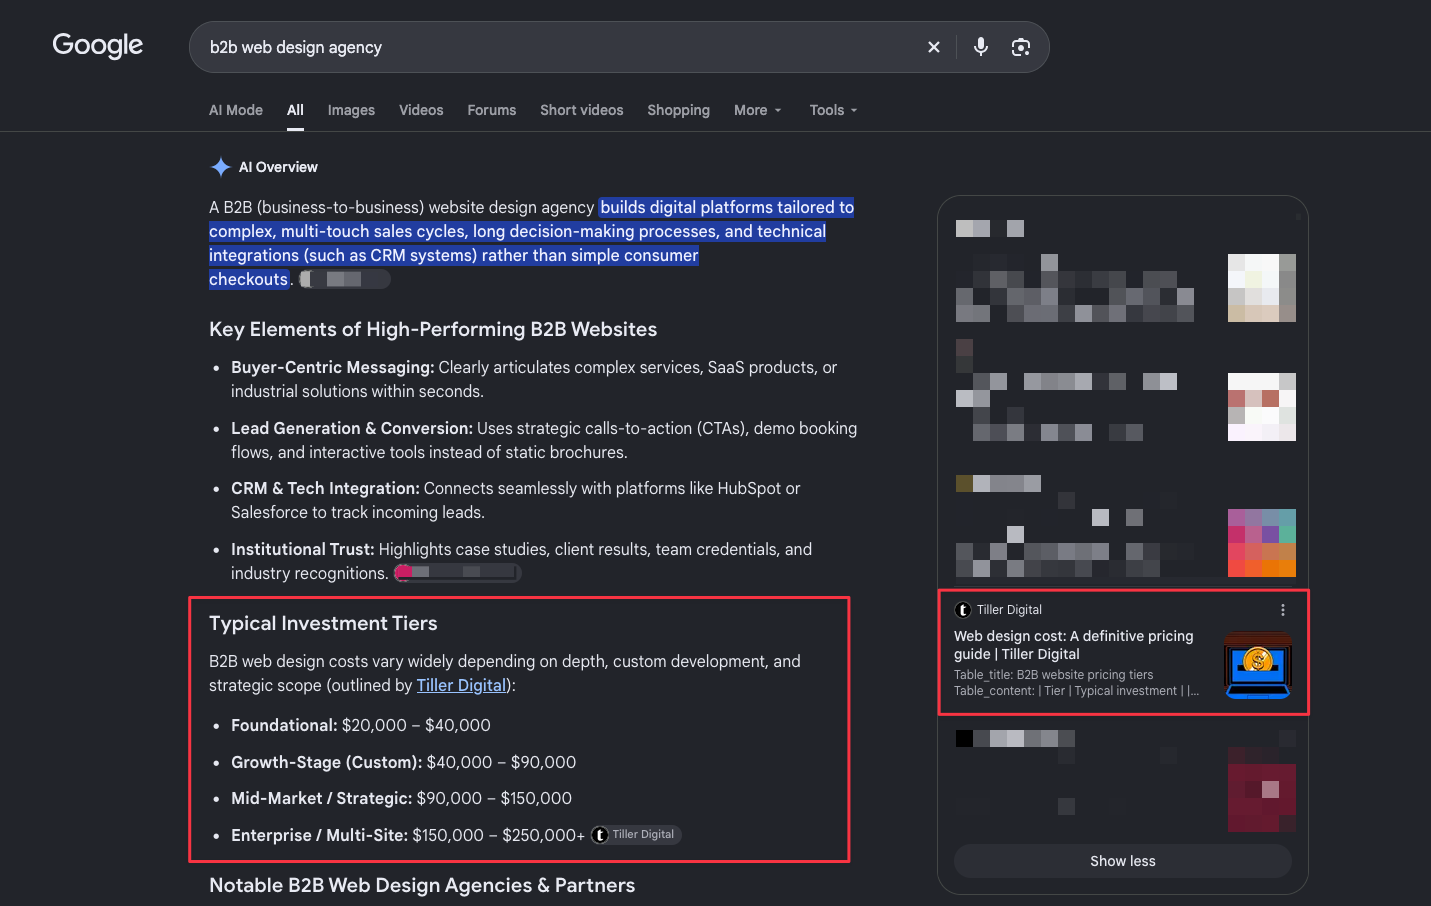
Google's AI Overview for “b2b web design agency” takes its pricing tiers from Tiller's pricing guide and credits Tiller by name. Google AI Overview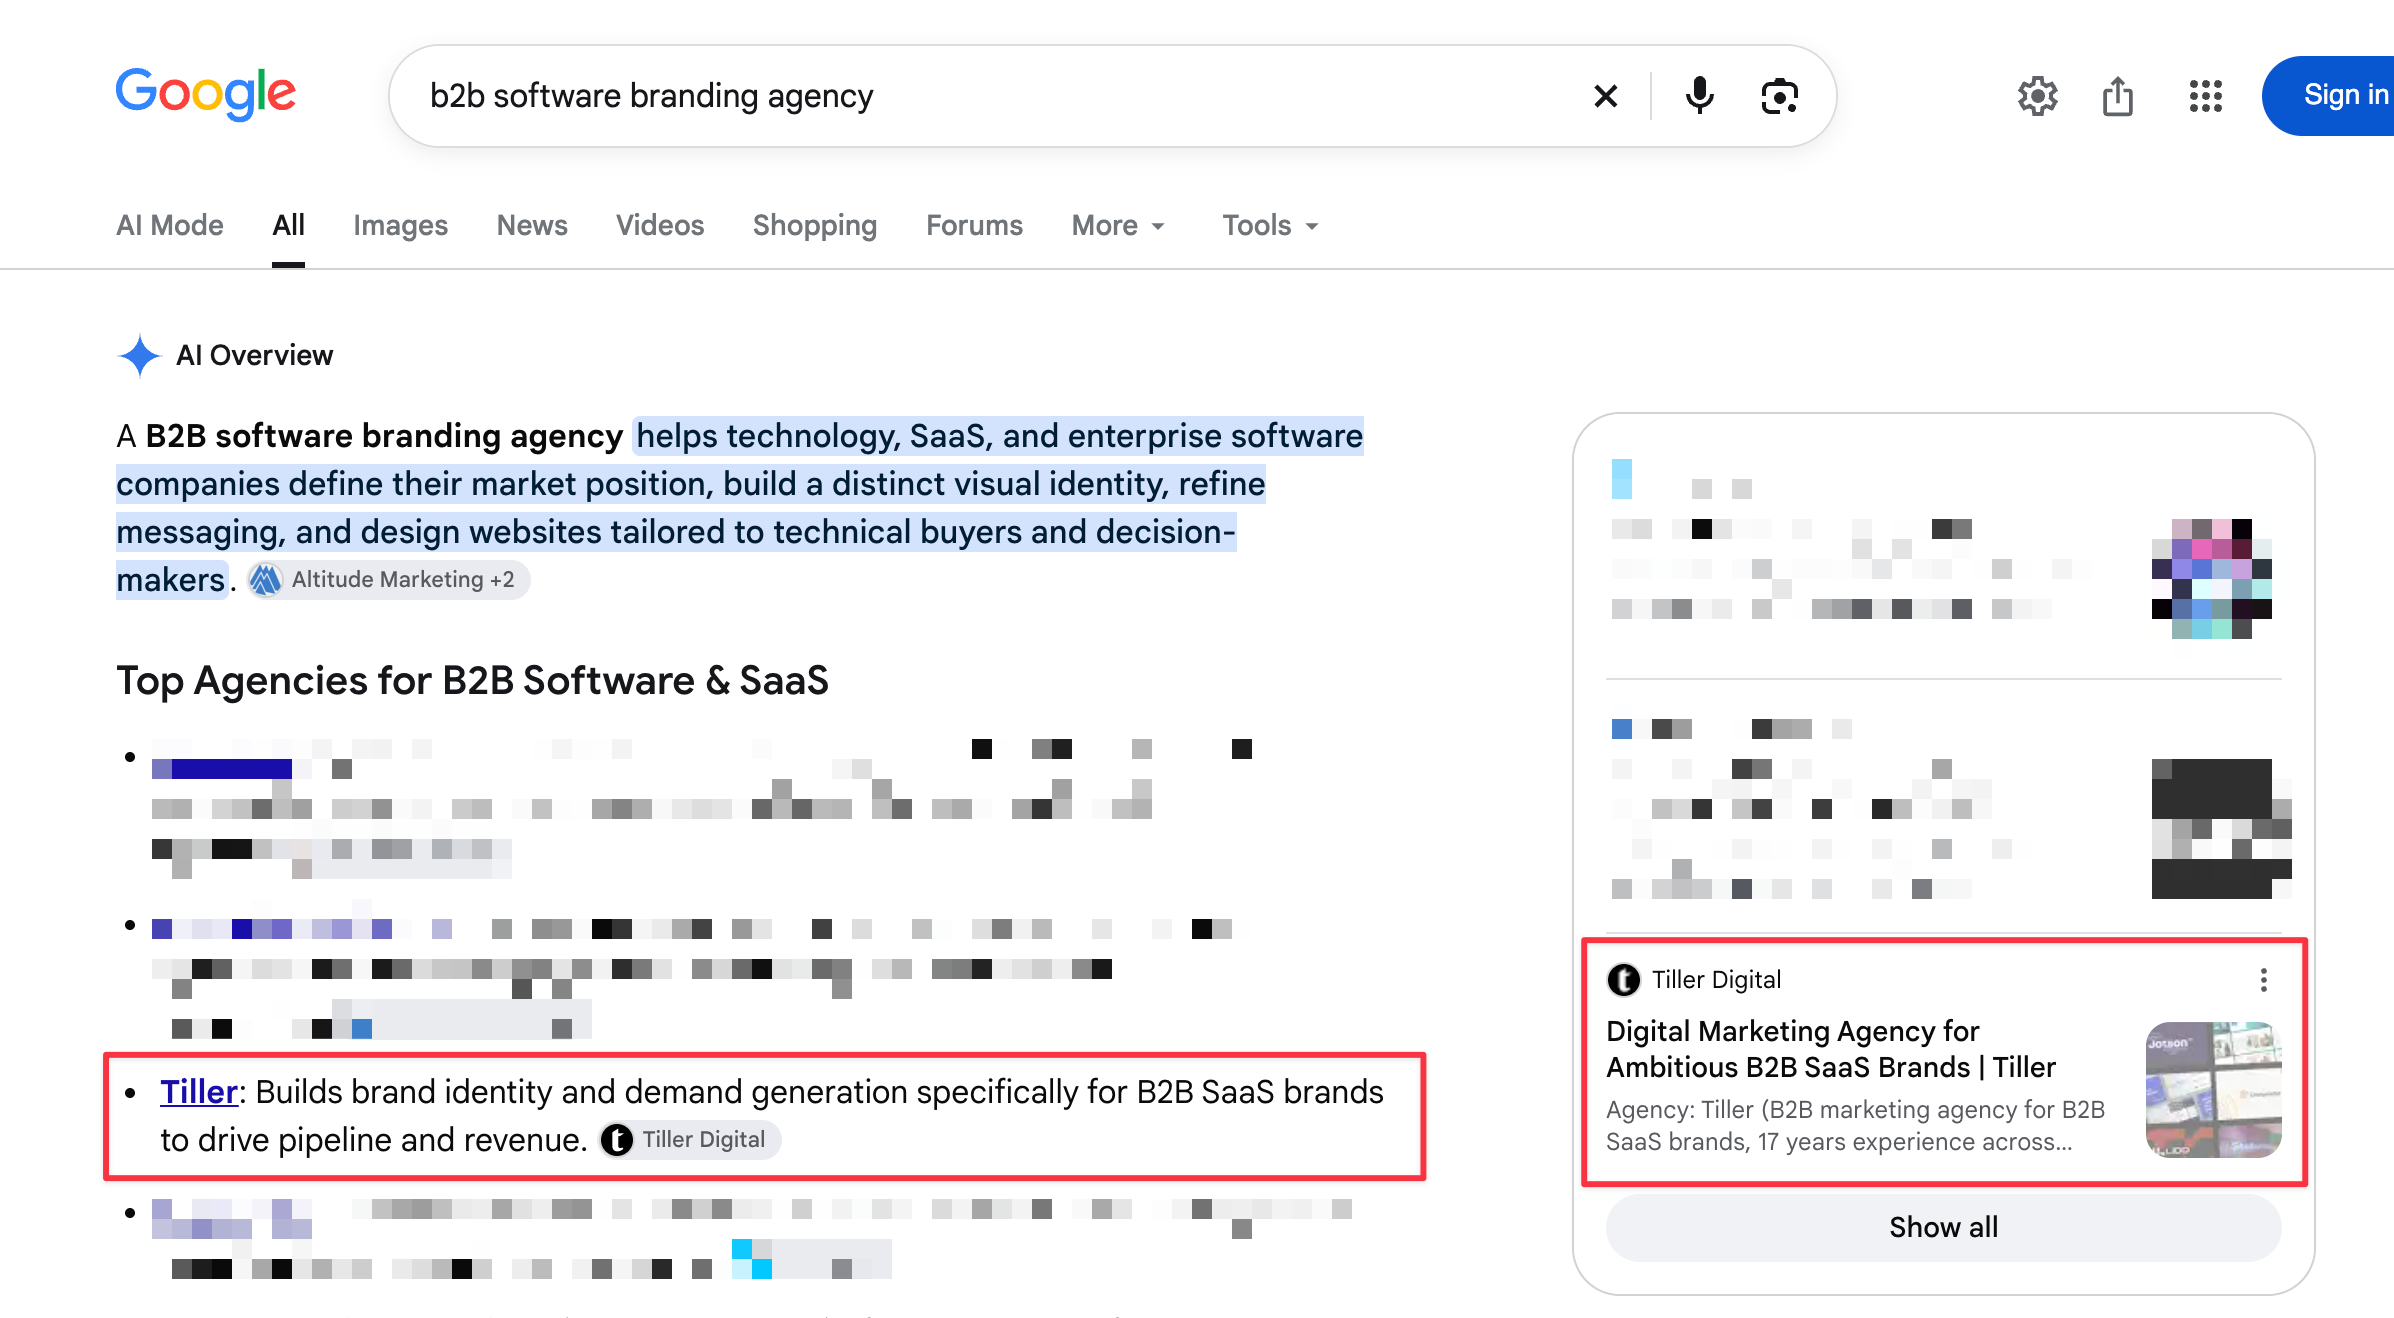
Google's AI Overview for “b2b software branding agency” names Tiller among its top agencies for B2B software and SaaS, and cites Tiller's homepage. Diversification
Then: Tiller sold services only, and worried about what AI would do to that business.
Now: I helped Tiller create Brand Rover, a new business and product of its own.
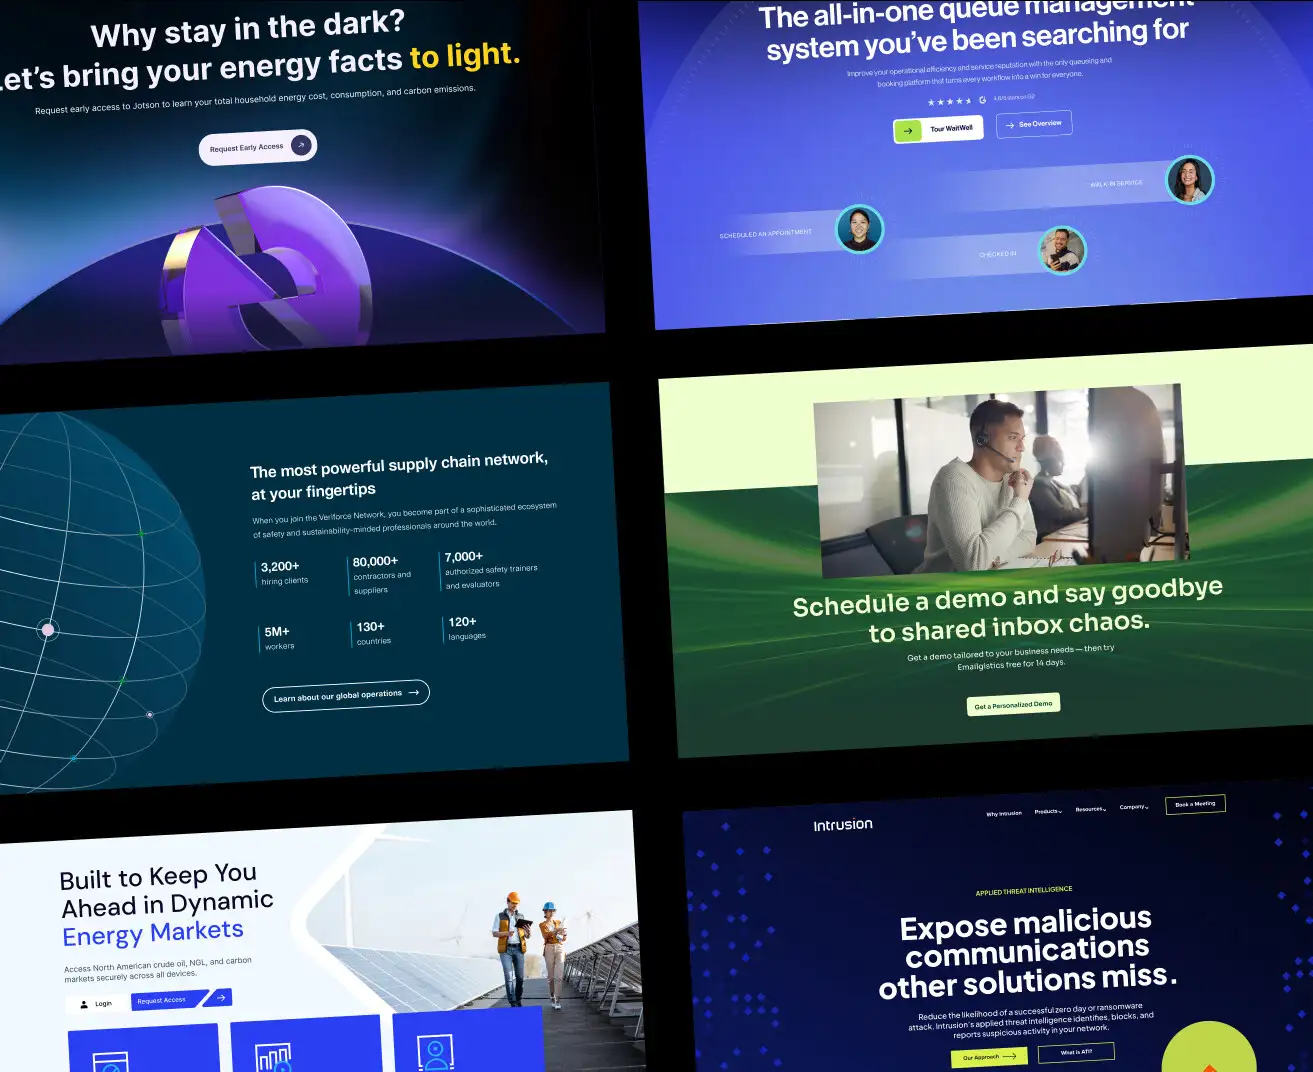
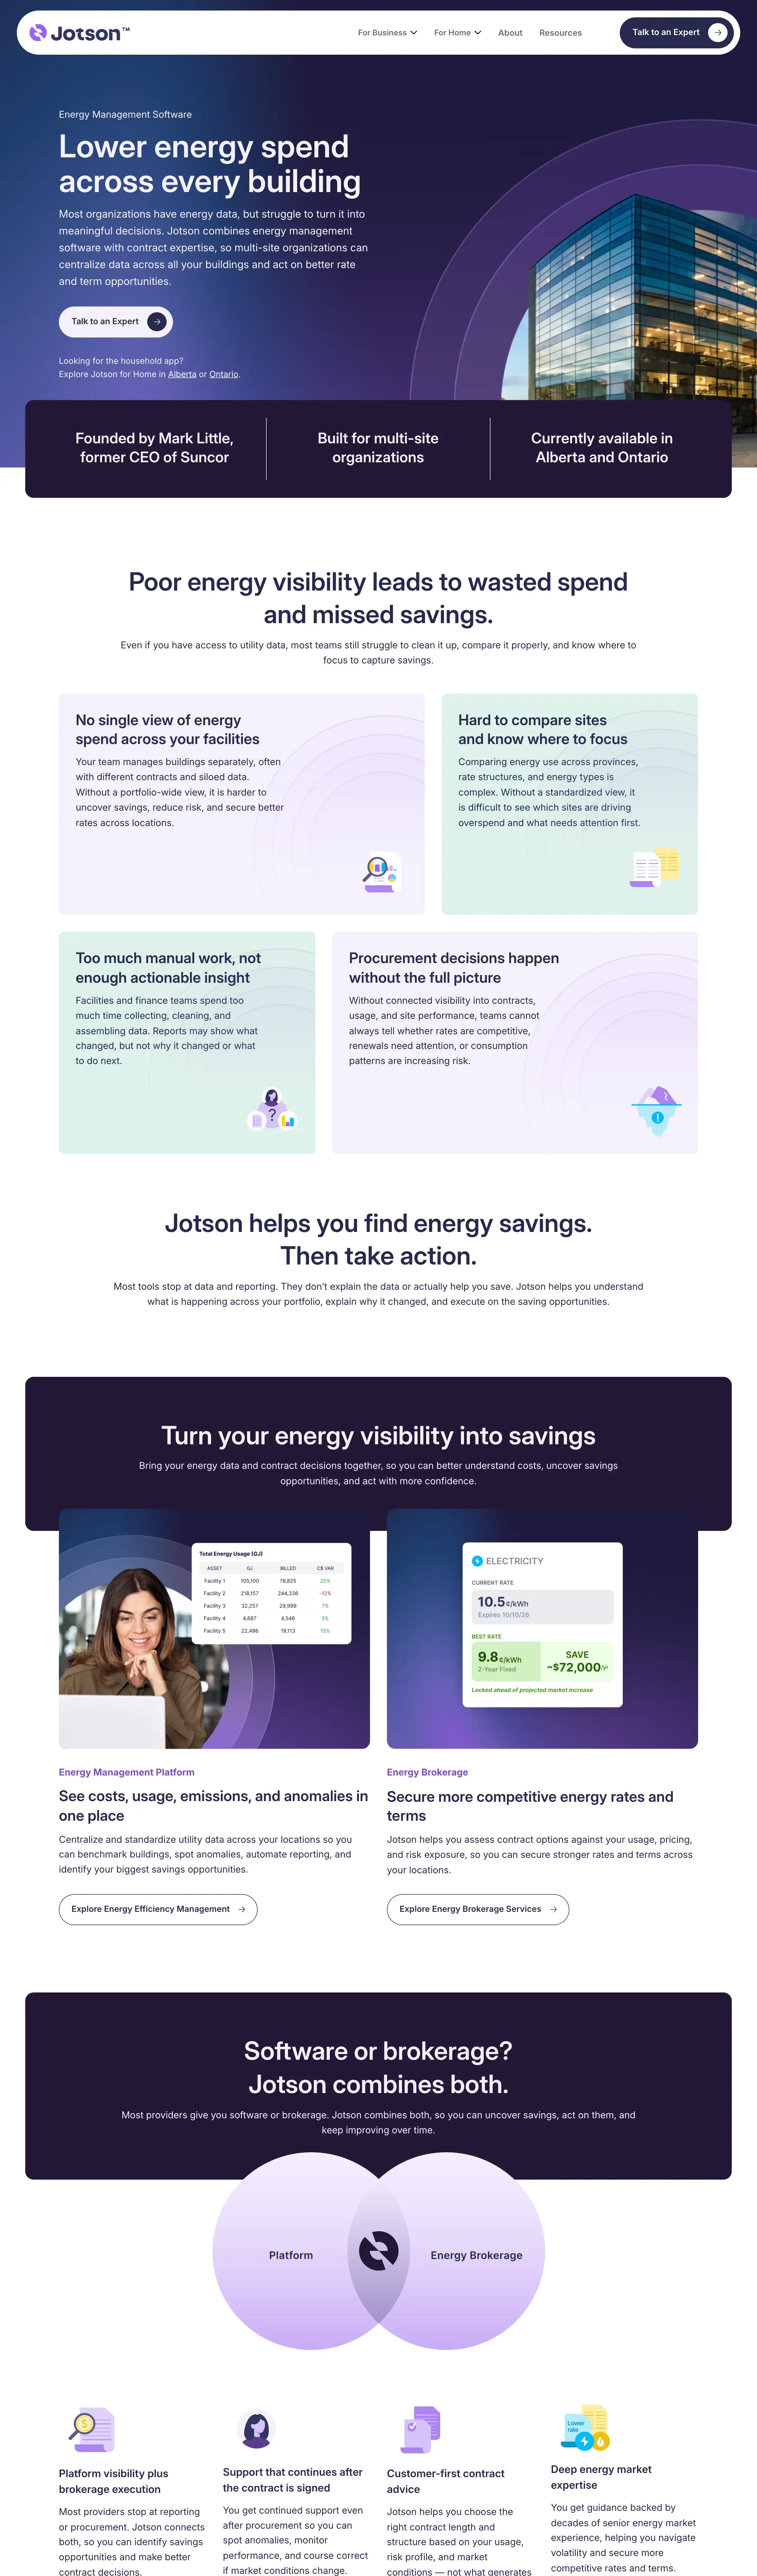
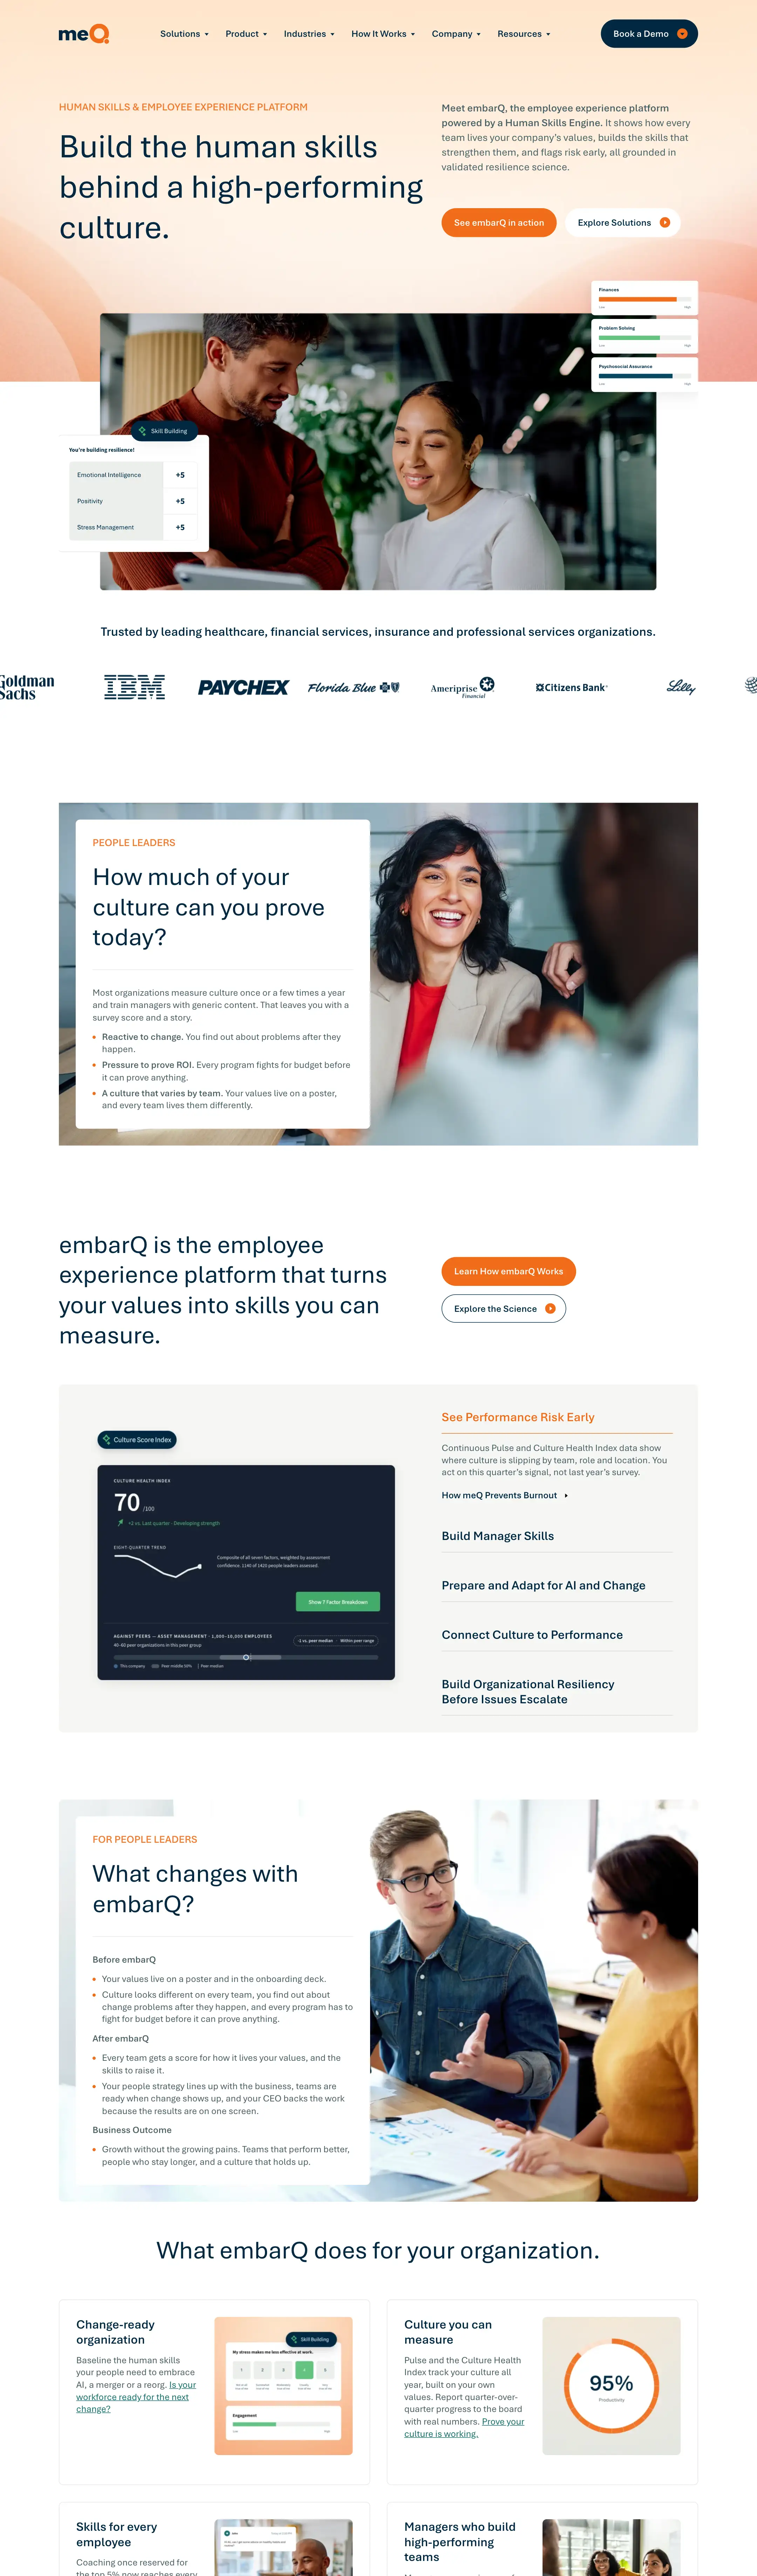
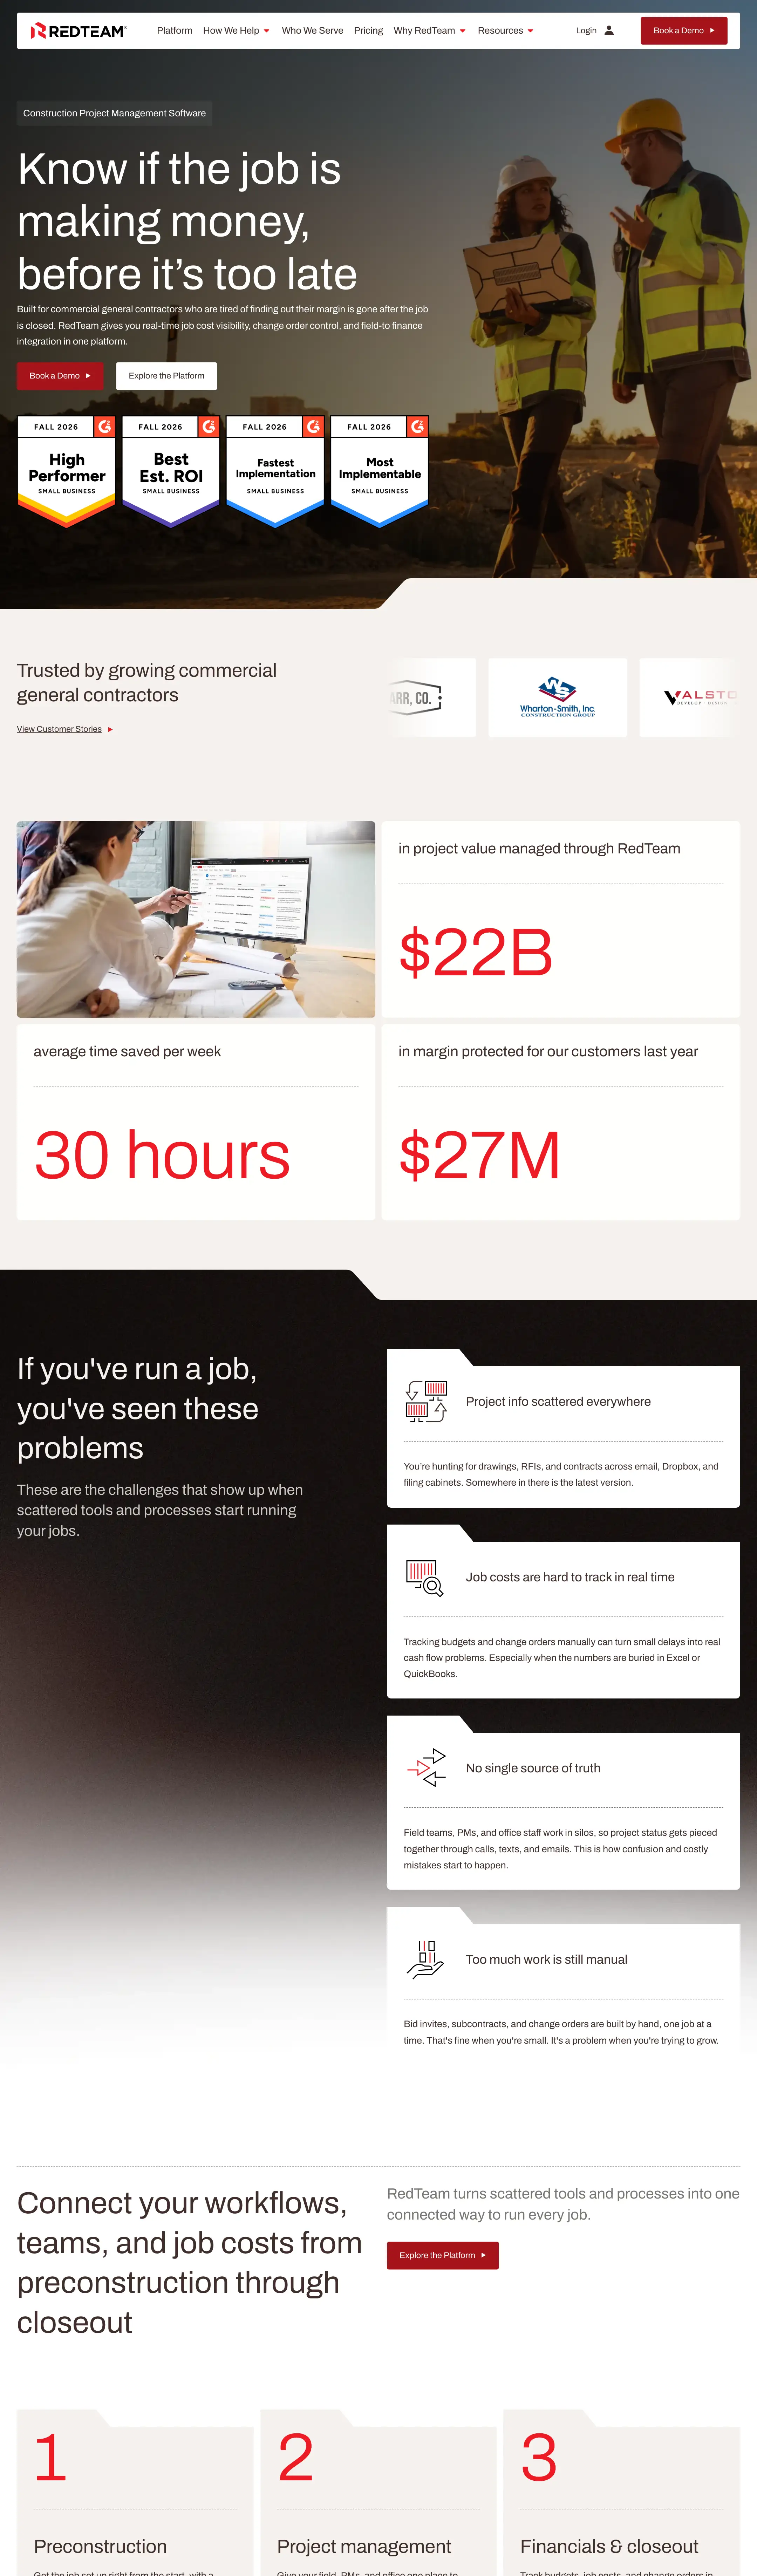
These are the sites we shipped
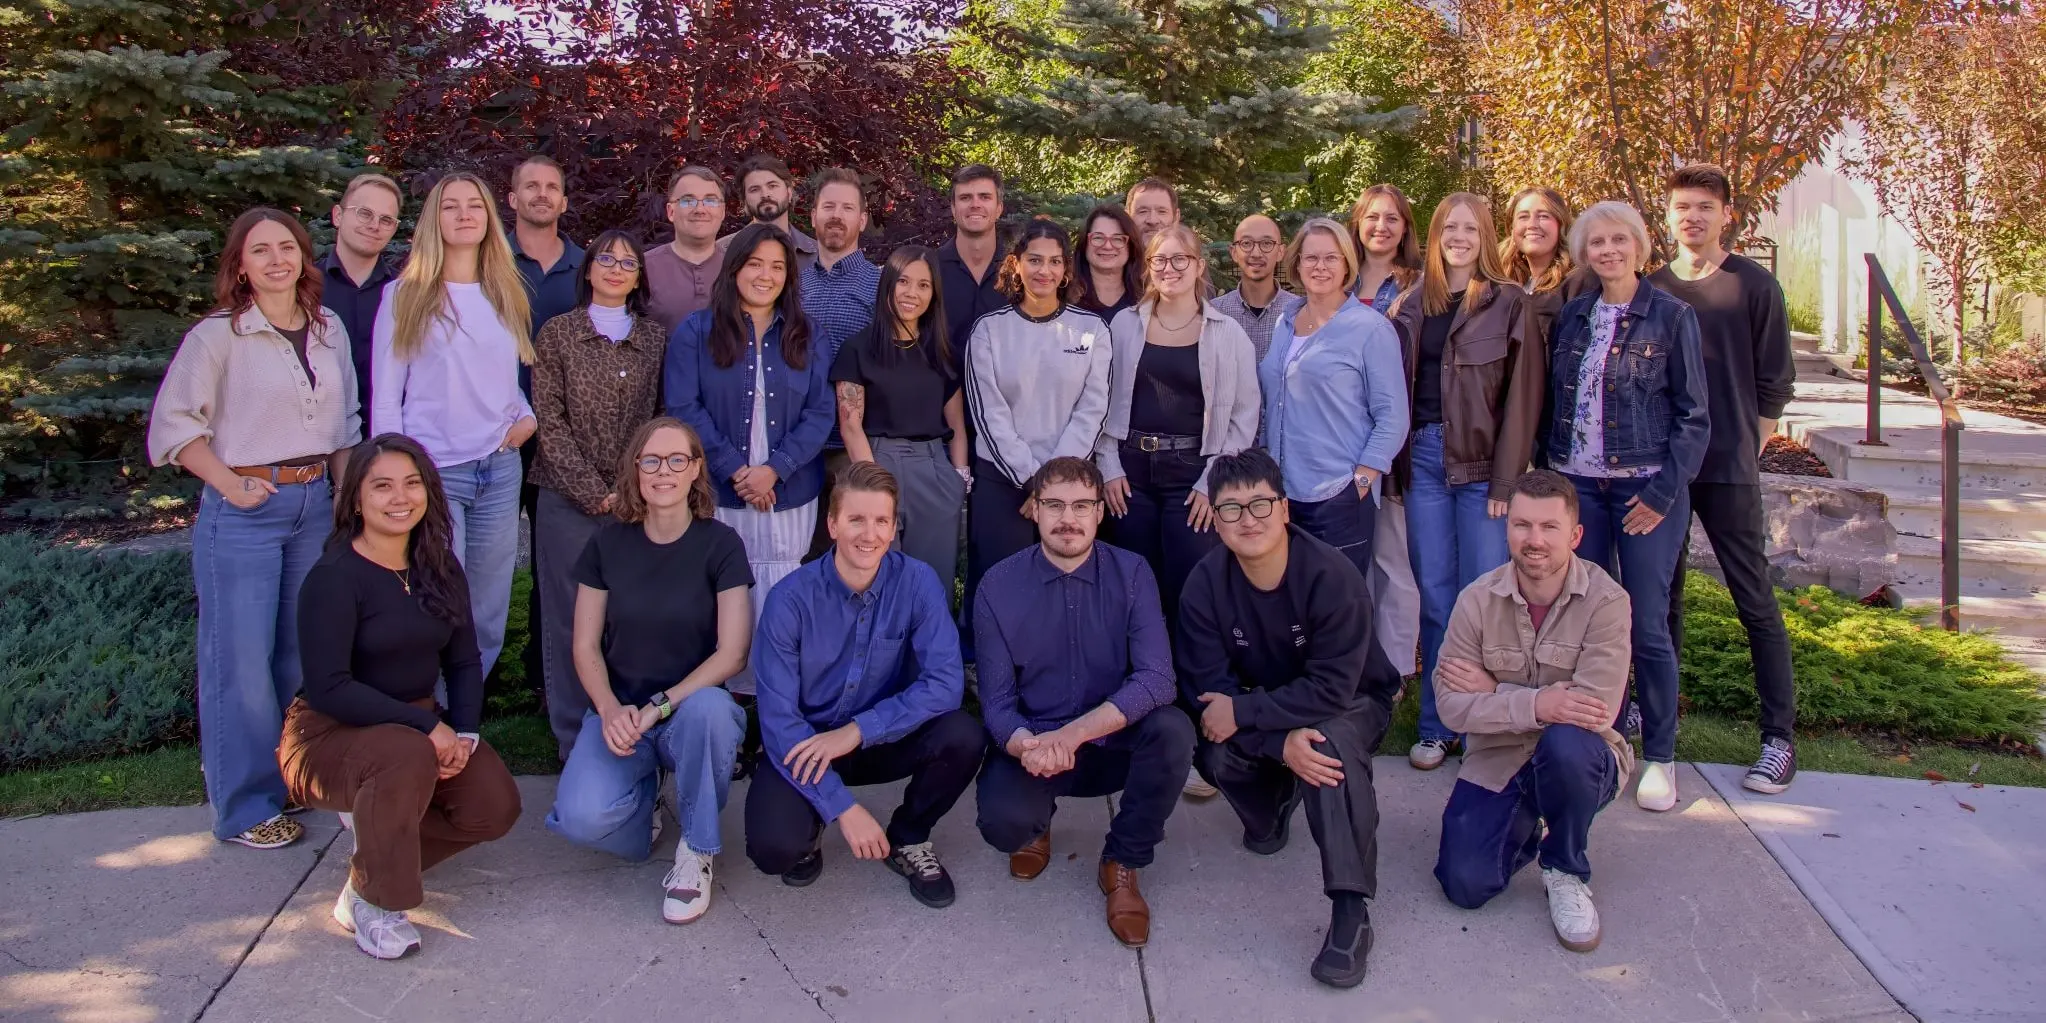
A look inside Tiller